Why can the same drug work differently in different patients?
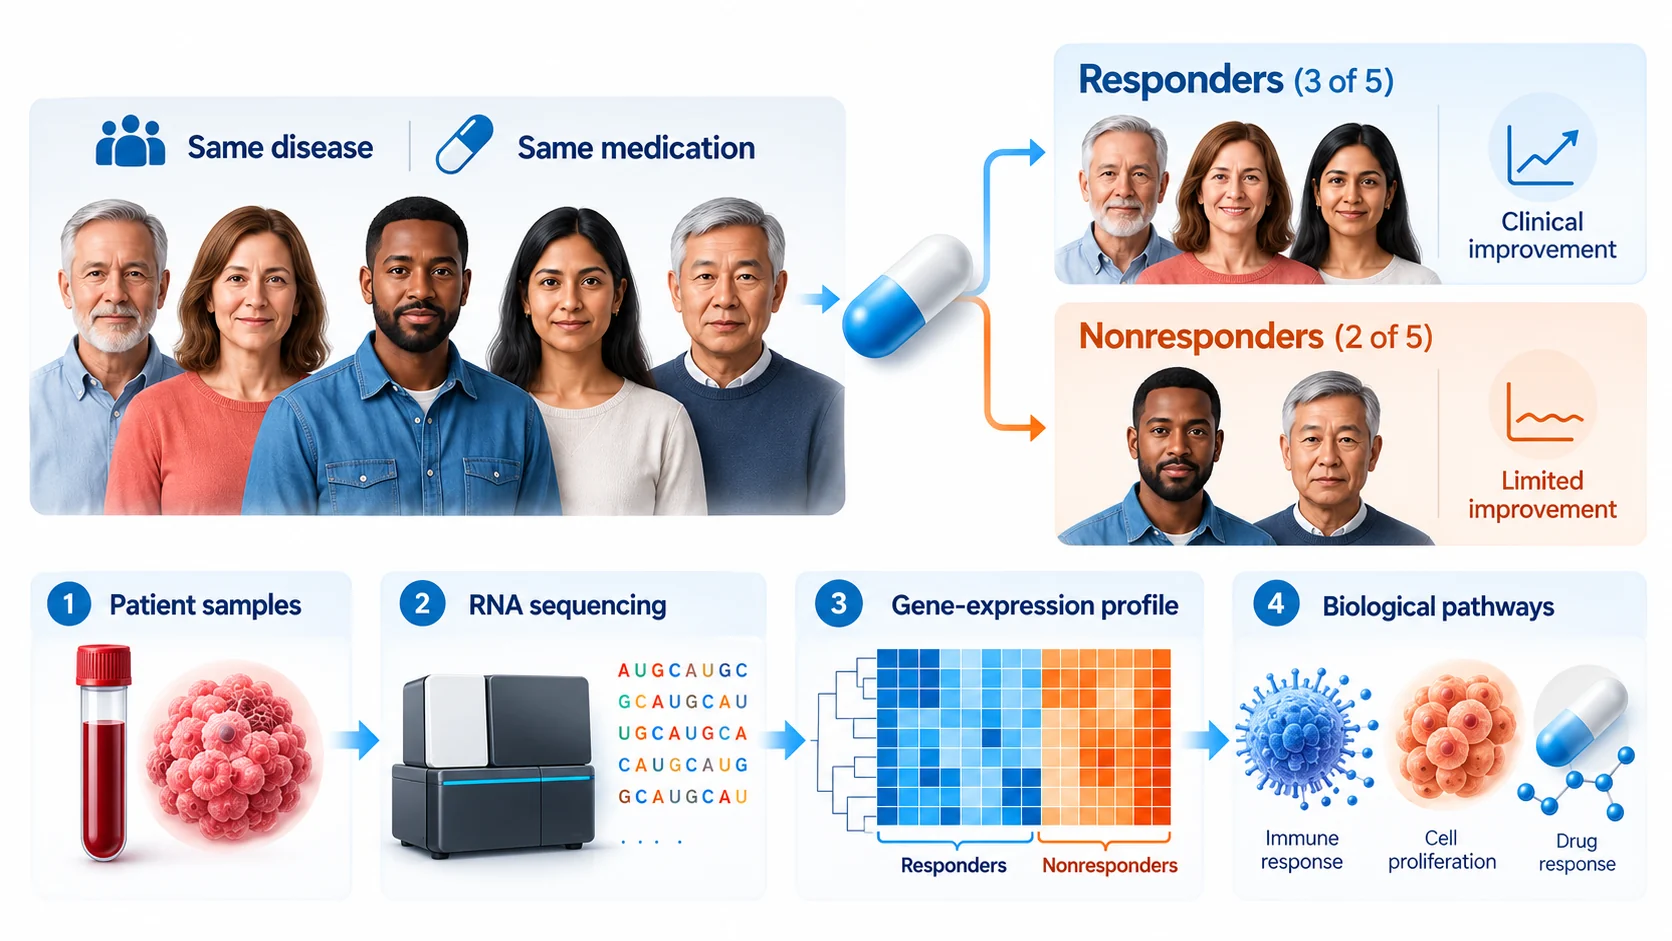
Two patients may receive the same medication for the same diagnosis and have very different experiences. One improves noticeably. Another experiences little change. A third develops side effects that make continued treatment difficult. As illustrated in Figure 01, these differences raise a question that is both simple and challenging: can we identify biological features associated with the way patients respond?
There are many possible influences. Patients may differ in disease subtype, age, immune activity, other medications, genetic background and the amount of drug their bodies are exposed to. Researchers might investigate RNA from blood or relevant tissue to look for patterns linked to clinical response. Those patterns can narrow the next set of questions, but they are not a complete explanation of an individual patient’s outcome.
Imagine that RNA associated with immune signaling is more abundant in samples from patients who improved. The observation would be worth investigating. It would not establish that immune signaling made the drug work. Perhaps the difference existed before treatment; perhaps the samples contained different proportions of immune cells. An unmeasured clinical factor might also contribute. RNA-seq is most useful when researchers resist the temptation to turn an association into a conclusion about cause.
At a glance: what is bulk RNA-seq?
Bulk RNA sequencing, usually shortened to bulk RNA-seq, measures RNA in a sample made up of many cells. Because the amount of RNA from a gene can change as cells respond to illness, treatment or their surroundings, these measurements help researchers investigate gene expression. They do not directly reveal how much protein a cell makes or whether a biological pathway is active. A useful RNA-seq result begins with a carefully collected sample and ends with a carefully qualified interpretation. [1]
The broad sequence of work is straightforward: decide what to compare, collect and document the samples, sequence their RNA, examine data quality, estimate RNA abundance, test the differences and interpret them in the context of the original question. Every stage affects the next. Attractive graphs cannot compensate for missing patient information or a poorly planned comparison.
First, the basics: DNA, RNA and gene expression
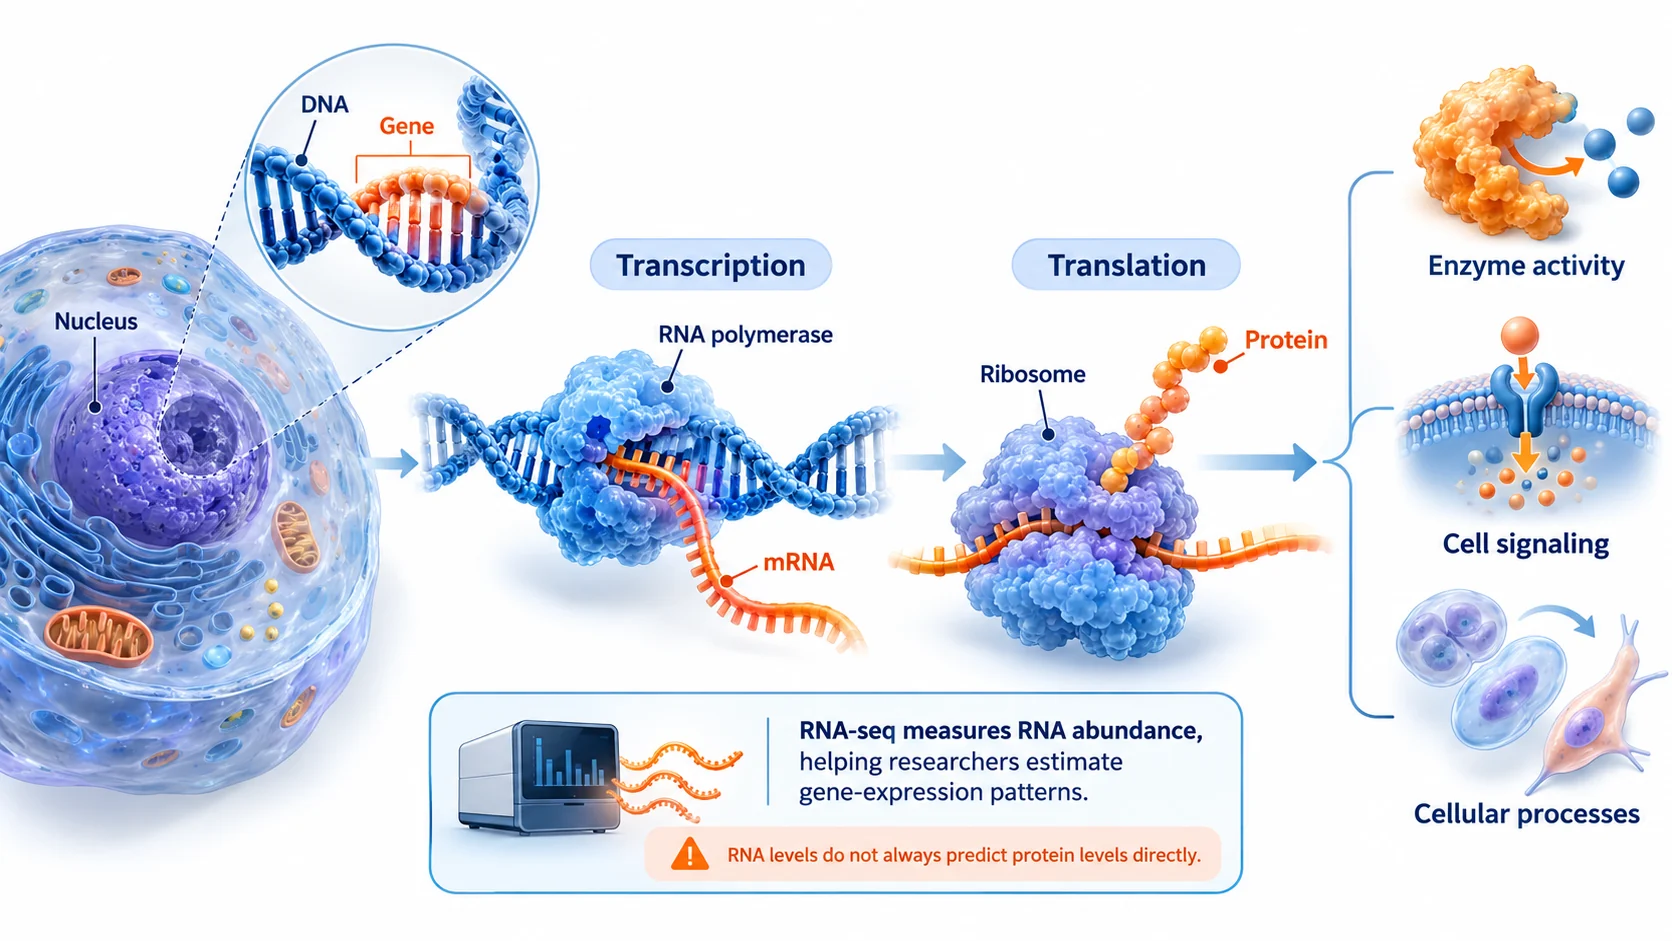
DNA carries the instructions used by living cells. When a gene is transcribed, the cell makes RNA from that genetic information. Messenger RNA helps convey instructions for making proteins; other forms of RNA have regulatory or structural roles. The amounts of these RNAs change with cell type, health, development and the environment. Researchers study those changes because they offer clues about what cells are doing (Figure 02).
“Gene expression” is a convenient phrase, but in an RNA-seq article it usually refers to measured RNA abundance. A gene with twice as much measured RNA is not necessarily making twice as much protein. RNA production, breakdown, cell composition and laboratory factors all affect the measurement. Readers should keep this distinction in mind when interpreting a differential expression result. [1]
What does “bulk” mean?
“Bulk” refers to the way the sample is measured. RNA from many cells contributes to one overall reading, much as an average can describe a group without telling you what each person contributed. Single-cell RNA-seq takes a different approach: it seeks information about individual cells or cell-associated partitions. The methods overlap in purpose, but they reveal different levels of detail.
Take a blood sample, which contains several kinds of immune cells. Suppose RNA from an immune-related gene increases between two visits. Did each cell make more of that RNA, or were there simply more cells of a type that already expresses the gene? Bulk RNA-seq alone may not distinguish the two possibilities. That limitation should shape the questions researchers ask of their data.
Step 1. Start with a research question, not a sequencing machine
The study should begin with a question precise enough to guide the design. For the drug-response example, researchers might ask: “Before treatment starts, do blood RNA patterns differ between patients who later respond and those who do not?” This makes the timing and the comparison clear. “Which genes are different?” does not.
The timing of the samples changes the meaning of the answer. Blood collected before treatment may help investigate markers associated with a later response. Samples taken before and after treatment can show changes over time. Neither comparison, on its own, proves that the medication caused those changes; disease progression, other treatments and time-related effects may also matter. An appropriate comparison group can help address that problem.
Biological replicates are people, not repeated computer files
If the scientific question concerns variation among patients, each independently enrolled patient is a biological unit. Sequencing the same patient library twice may provide technical information, but it does not add another independent patient. Replication gives statistical analysis information about how much measurements vary across genuine biological units. The required number depends on variability, expected effect size, study design and available resources; there is no responsible universal number for every RNA-seq study. [3,9]
Consider what would happen if every responder were recruited at one hospital and every nonresponder at another. A difference attributed to response could instead reflect collection methods, storage conditions, patient populations or sequencing batches. Researchers call this confounding: two explanations become difficult to separate. Recording clinical details and balancing laboratory processing can reduce the problem, although some uncertainty may remain.
What information belongs in a sample sheet?
A sample sheet connects every sequencing file to its source and study meaning. Typical fields include sample identifier, patient or donor identifier (appropriately de-identified), response group, collection time, extraction or sequencing batch, paired-sample relationship and relevant clinical covariates. Privacy and data-use safeguards are essential when human samples are involved. A mislabeled sample can undermine an otherwise technically excellent analysis.
Step 2. How does RNA become a FASTQ file?
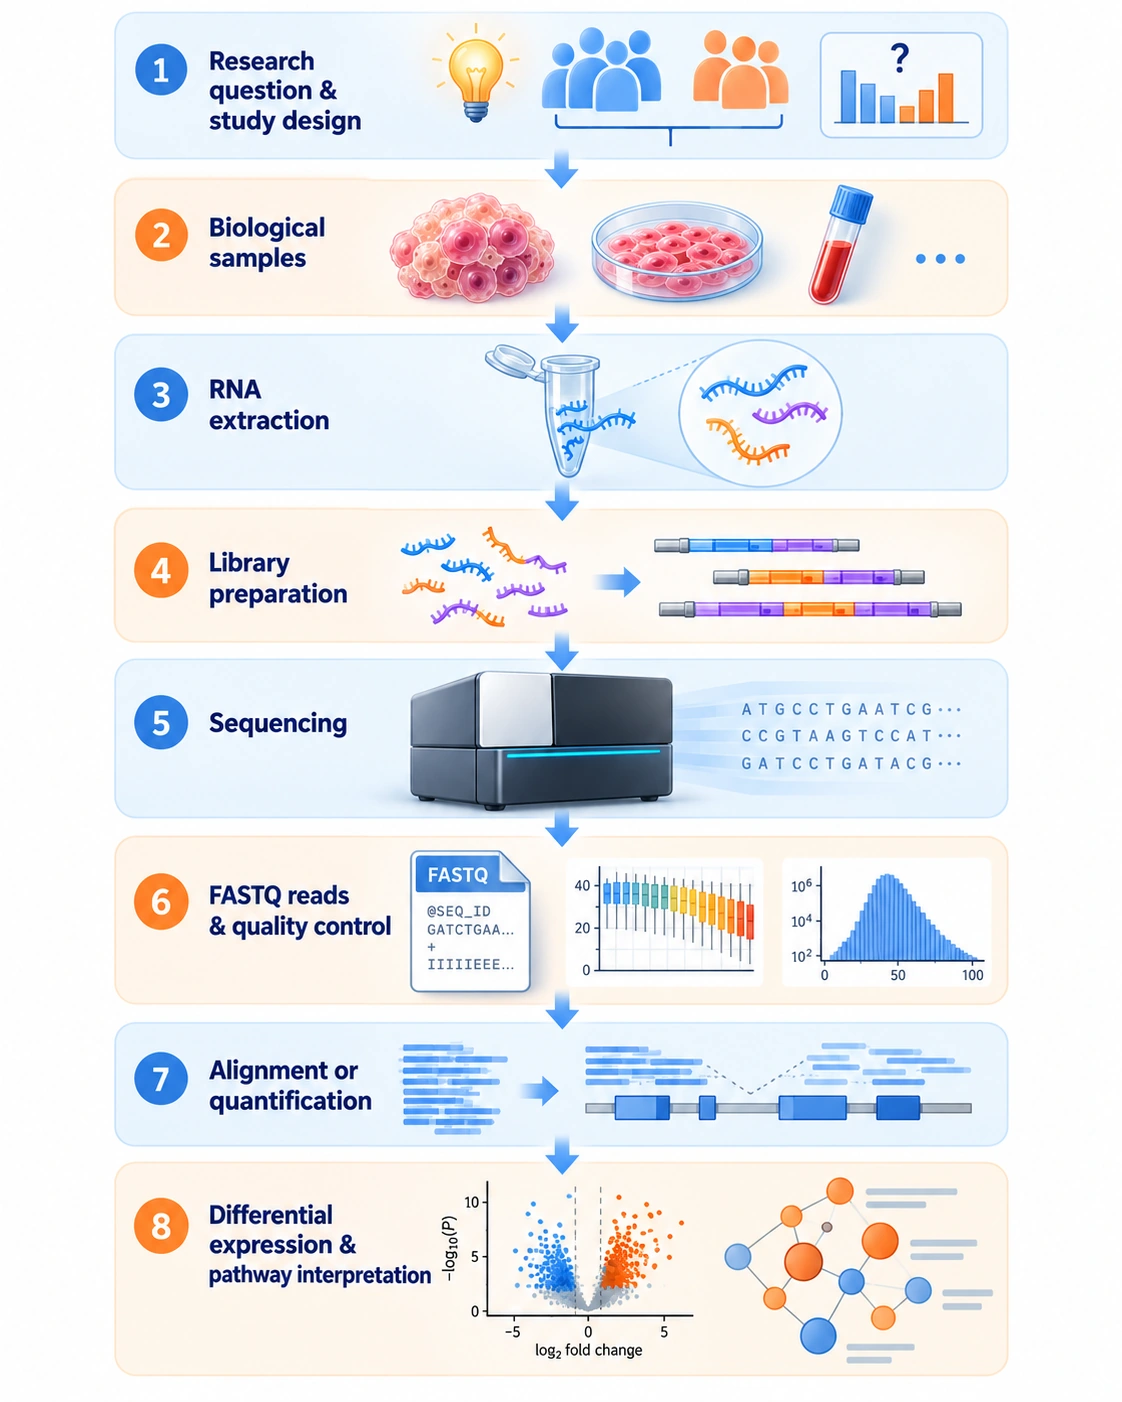
Once the study design is settled, laboratory work begins (Figure 03). Researchers collect blood or another suitable specimen, extract RNA and assess whether the material is usable. They prepare a sequencing library, a collection of molecules processed so that a sequencer can read them. Library preparation varies with the experiment, so the exact method matters when comparing studies or interpreting results.
One common output is a FASTQ file. Each record contains a sequence read and an accompanying series of quality scores. The quality scores express confidence in the base calls made by the instrument; they are not a score for whether the patient sample is clinically good or bad. Paired-end sequencing commonly produces two matched read files per sample, often described as R1 and R2.
A beginner’s guide to common RNA-seq file formats
| File | Purpose |
|---|---|
| FASTQ | Sequence reads and base quality scores |
| FASTA | Reference sequences |
| BAM / CRAM | Aligned read records |
| Count matrix | Gene-level values across samples |
| Sample sheet | Sample identifiers and experimental metadata |
| Results table | Effect sizes and statistical results |
These files serve different purposes. A gene count matrix is not a substitute for the original quality reports, and a list of significant genes is not a complete record of the analysis. Maintaining the link between files, reference versions and sample identifiers is part of scientific reproducibility.
Step 3. Quality control: checking the data before trusting the answer
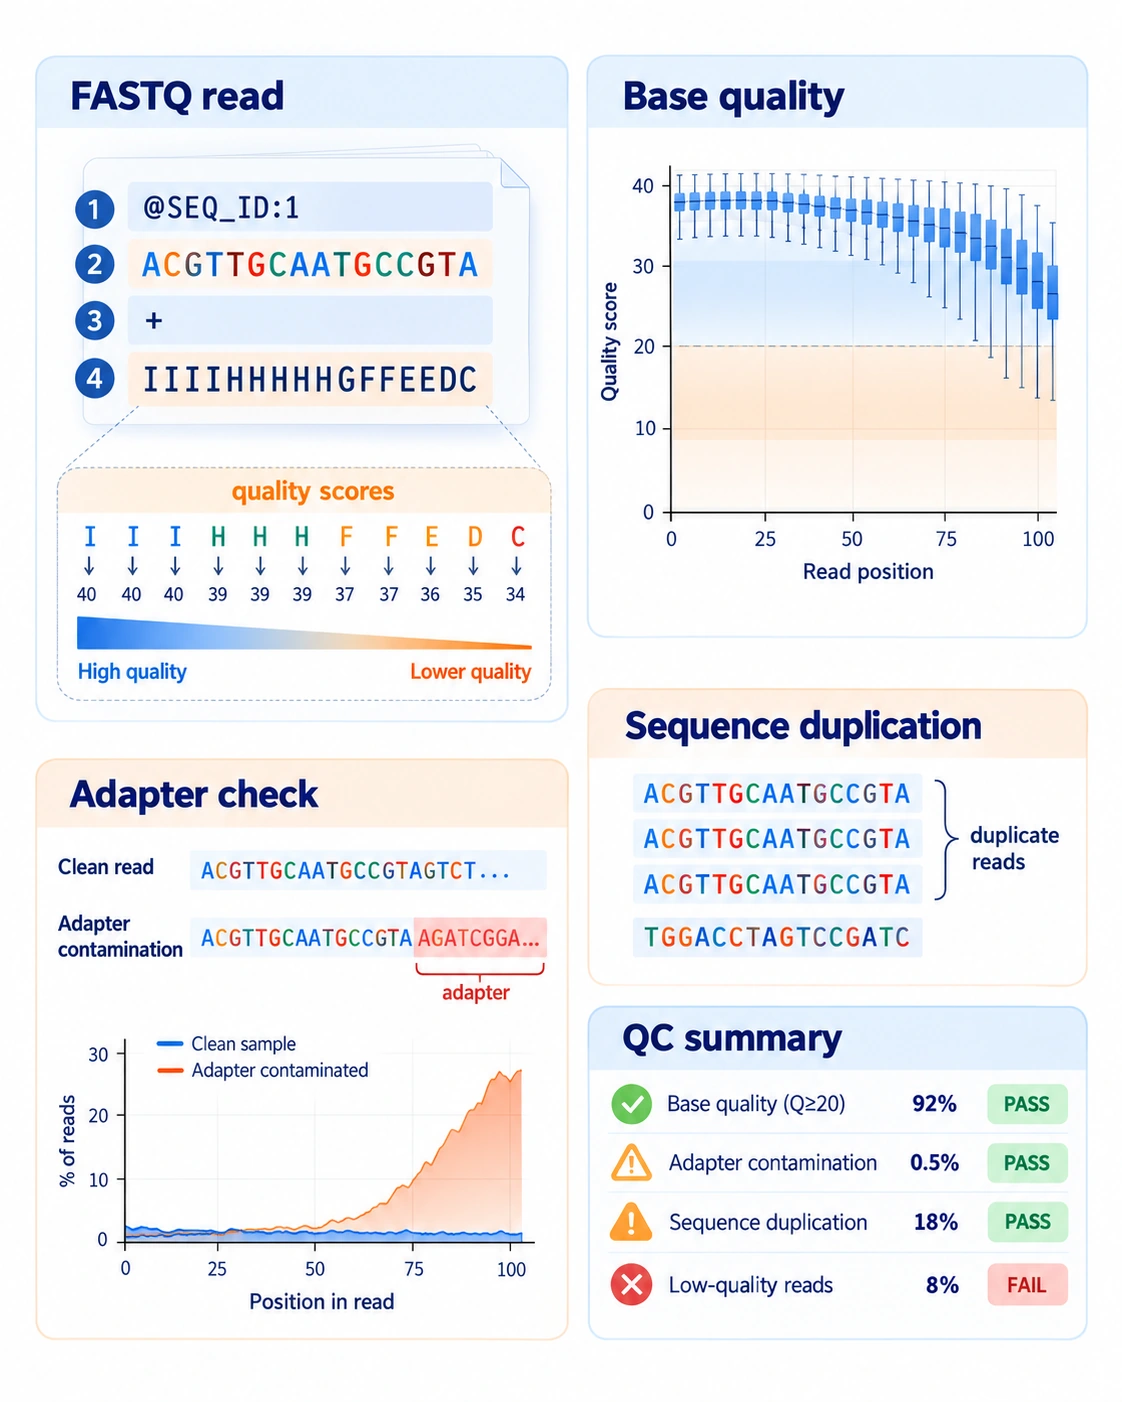
RNA sequencing can produce millions of reads from a sample. Before making biological claims, researchers need to know whether those reads are reliable enough for the intended analysis. Quality control, or QC (Figure 04), looks for warning signs such as declining base-call quality, leftover adapter sequences, unexpected library characteristics, uneven sequencing depth or poor alignment to a reference.
Tools such as FastQC summarize individual read sets, while MultiQC can combine outputs into a report that is easier to compare across many samples. A warning is a prompt to investigate, not proof that a sample must be deleted. Some metrics depend strongly on the library protocol and biological material. Decisions about excluding samples should have a documented rationale. [8]
In the patient example, imagine one sample has far fewer usable reads than the others. Its unusual profile might partly reflect a technical problem. Another sample might stand apart because that patient has a genuinely different immune response. A QC report cannot make that judgment alone. The right response is to investigate, document the finding and assess how it affects the conclusions.
Step 4. Alignment and quantification: which genes do the reads represent?
After QC, the analysis needs to determine where the sequenced fragments probably came from. One route aligns reads to a reference genome, for example with STAR. Another estimates transcript abundance using a transcriptome-focused method such as Salmon. The strategies differ in computational details, assumptions and outputs, so the workflow should be chosen for the experiment rather than selected because one tool has a familiar name. [6,7]
A reference genome is an organized sequence representation; an annotation tells software where known genes and transcripts are located. The reference assembly and annotation release should be recorded and used consistently across samples. Mixing incompatible versions can lead to missing or incorrectly matched features.
The next output may be a gene-level count table or transcript abundance estimates that are imported and summarized for downstream testing. Raw read counts, estimated counts, transcripts per million (TPM) and fragments per kilobase per million (FPKM) are not interchangeable. In particular, ordinary TPM or FPKM measurements should not be passed to a count-based differential expression method as if they were raw counts. Transcript-to-gene workflows require suitable import and statistical handling. [2,5,11,14]
Step 5. Normalization and sample-level checks
Not every sample produces the same number of sequence reads. If one library has many more reads, its raw gene counts may also be higher for technical reasons. Normalization helps make comparisons more meaningful by accounting for important differences in sequencing output and composition. It does not erase differences in cell populations, collection protocols or all possible batch effects.
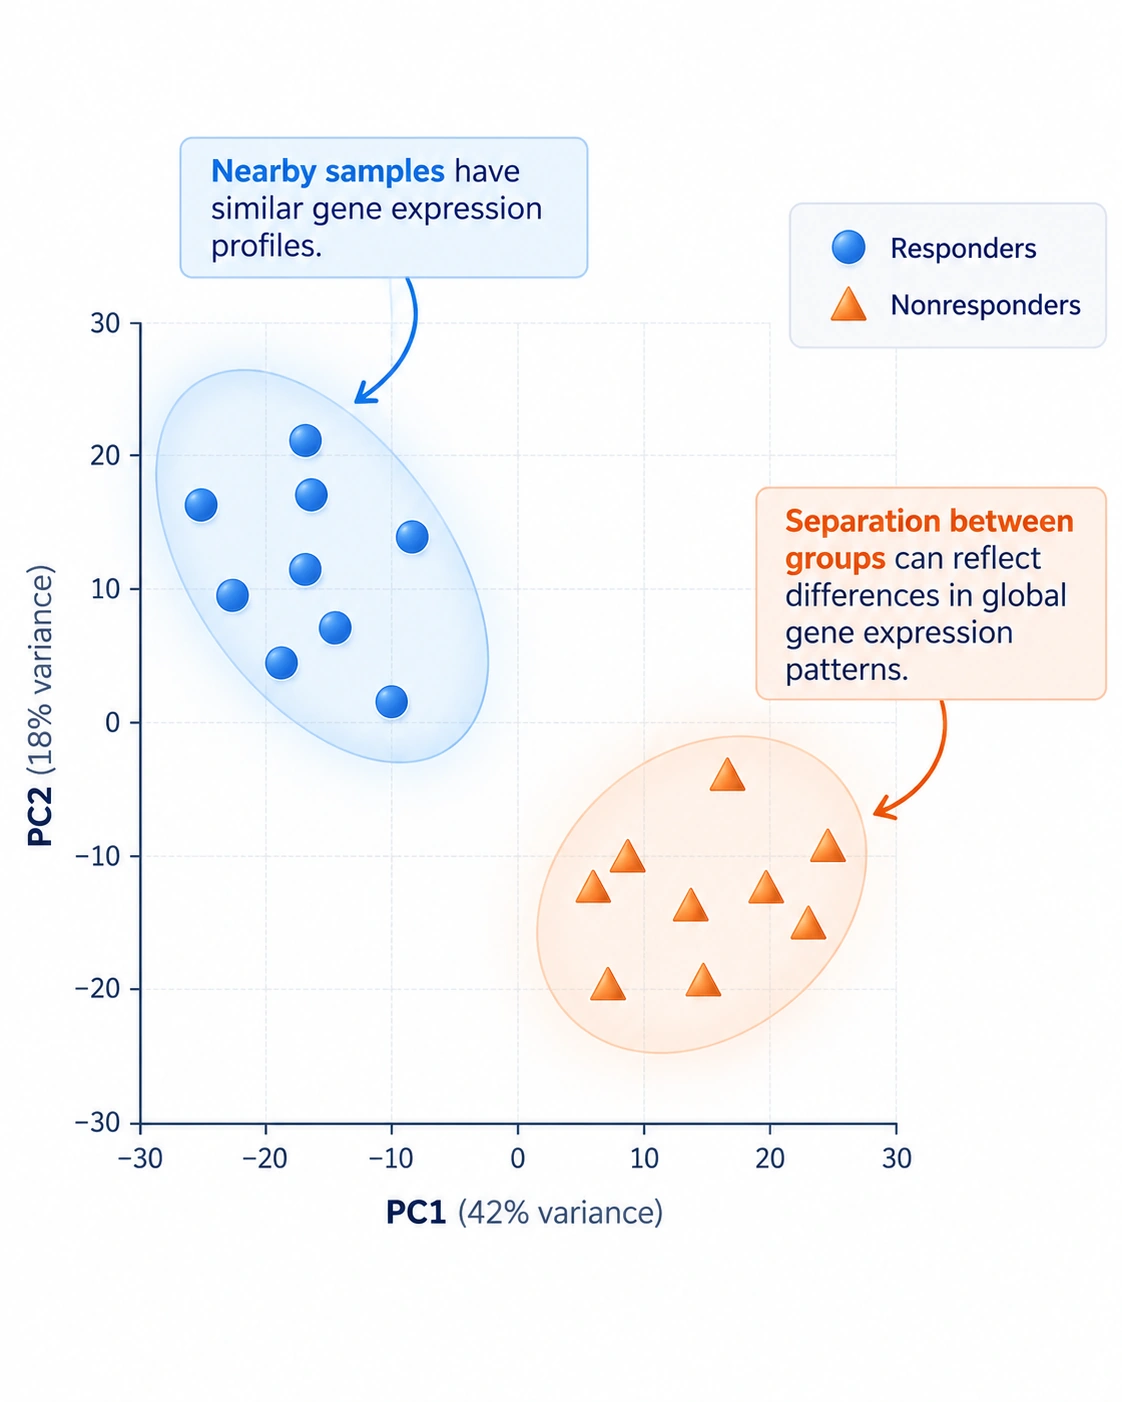
Before asking which individual genes differ, researchers examine whether the samples make sense as a group. They may compare library sizes, expression distributions, correlations and unsupervised plots. A principal component analysis (PCA) plot condenses major patterns of variation into a small number of axes (Figure 05). Samples close together often share broad features, while separated samples differ along the displayed axes.
What does an RNA-seq PCA plot show?
Imagine a PCA plot in which most responders cluster on one side and nonresponders cluster on the other. That could be a promising observation. Yet the separation might also reflect age, collection site, immune-cell composition, sequencing batch or another correlated factor. PCA is a diagnostic picture, not a clinical prediction model and not proof of a treatment mechanism. Samples that fall far from their group should be investigated before any exclusion is considered.
Step 6. Differential expression: comparing genes responsibly
A differential expression analysis asks whether the data support a consistent RNA abundance difference between clearly defined groups. Researchers often use tools such as DESeq2, edgeR or limma-voom, each with particular statistical assumptions and input requirements. The method matters, but a correct statistical model also depends on knowing which patients belong to which group and whether factors such as batch or pairing must be considered. [2,10,12,13]
The analysis usually produces one row per gene, with an estimated effect size and one or more measures of statistical evidence. The meaning of the sign matters. If the contrast is responder versus nonresponder, a positive log2 fold change generally indicates higher estimated expression in responders; reversing the contrast reverses the sign.
Log2 fold change in plain English
A log2 fold change of +1 corresponds to an estimated twofold ratio, while −1 corresponds to approximately half as much expression under the defined comparison. A value of +1.5 corresponds to roughly 2.8-fold. These are model-based estimates, not guarantees about every individual patient. For genes with limited information, uncertainty and effect-size shrinkage can affect the most responsible interpretation. [2]
What does an adjusted p-value mean?
RNA-seq may test thousands of genes at once. When so many statistical tests are performed, some small p-values arise by chance even if nothing meaningful is happening. Adjusted p-values account for multiple testing; one common approach seeks to control the false discovery rate (FDR). An adjusted p-value below a chosen threshold can support a statistical finding under the model, but it is not the probability that the particular gene is “truly causal,” nor is it a measure of clinical importance. [15]
A gene can have a large estimated fold change but little statistical support if measurements are noisy. A gene can also show a very small yet highly precise difference that may not matter biologically. Good interpretation considers effect size, uncertainty, sample characteristics and the scientific question together.
Step 7. Turning a gene list into biological understanding
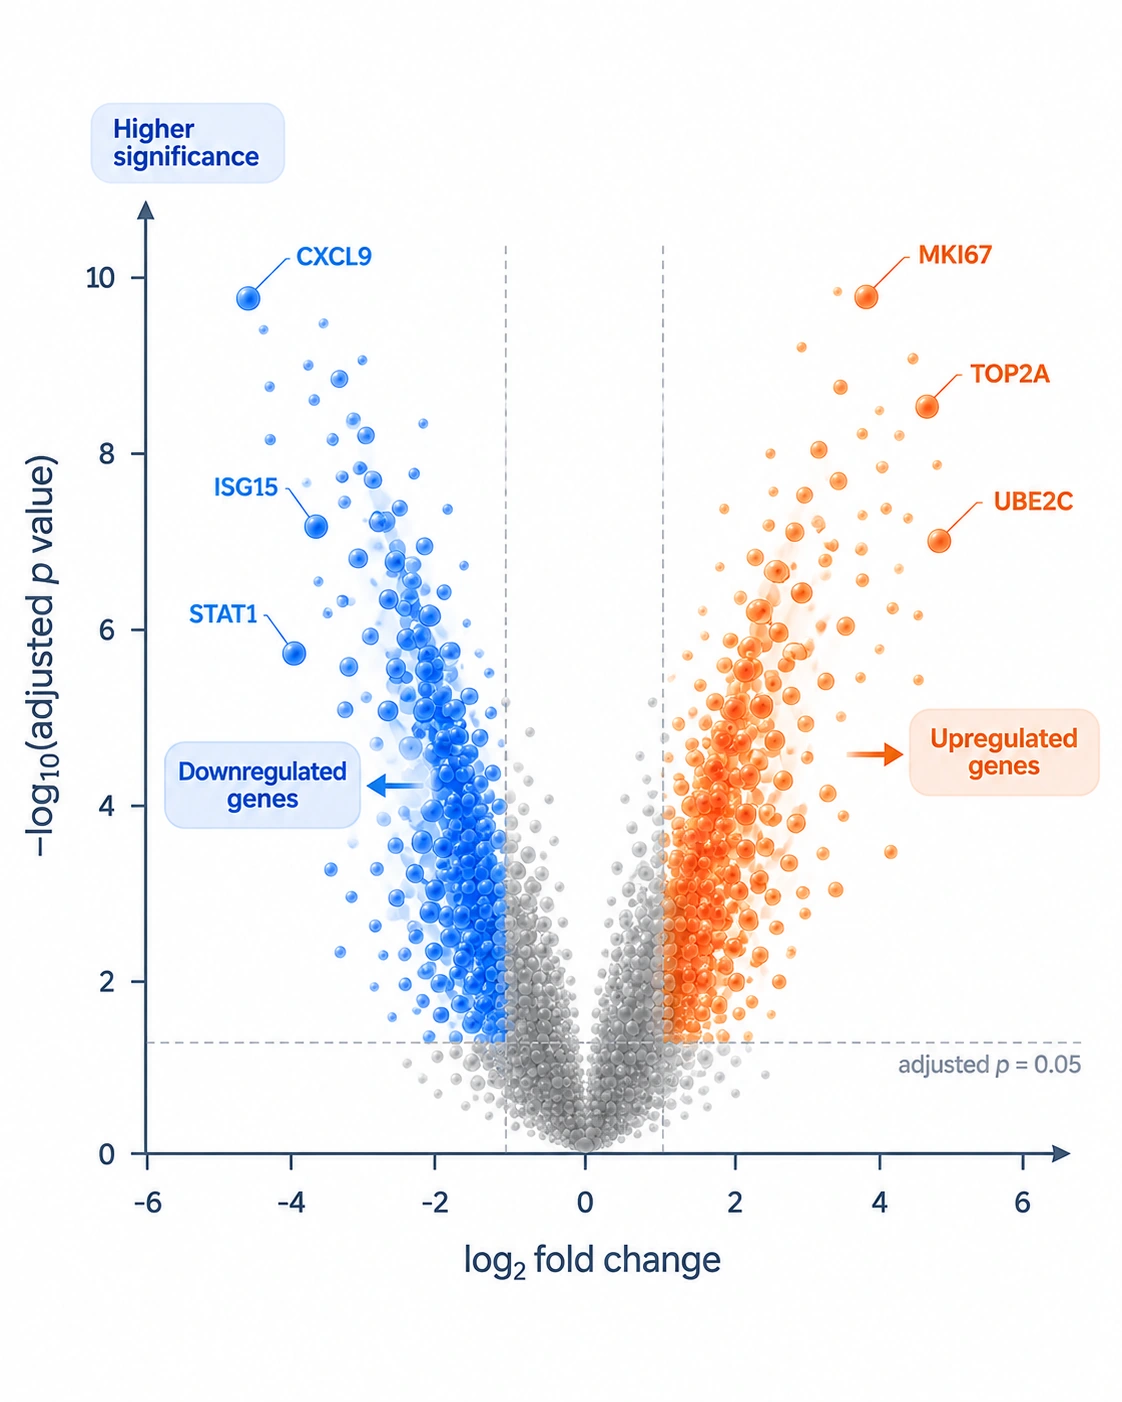
Once a differential expression table is available, the work moves from detection to explanation. A volcano plot places an effect-size measure on one axis and a statistical-evidence measure on the other (Figure 06). It can help identify conspicuous changes but should not be read as proof that points near its corners are drug targets. A heatmap displays patterns across genes and samples; its appearance depends on which genes are selected and how values are scaled.
Return to the patient study. Suppose several genes involved in inflammatory signaling differ between response groups. A careful summary would say that inflammatory-signaling genes contributed to an observed difference in RNA profiles. It would be premature to claim that one pathway made the drug effective. That stronger explanation would require additional work, potentially including an independent patient cohort and experiments designed to test a mechanism.
Return to our hypothetical patient study. If responders show a distinct inflammatory-signaling pattern, the appropriate first conclusion might be: “RNA profiles differed between response groups, and genes associated with inflammatory signaling contributed to the observed pattern.” That is more defensible than saying the drug succeeded because one pathway was switched on. Follow-up studies, independent cohorts and possibly functional experiments would be required to examine mechanisms and assess predictive value.
Can RNA-seq predict which patient will respond to a drug?
It may contribute to research on biomarkers and prediction, but an association observed within one dataset is not a validated patient-level test. Predictive models require careful separation of training and evaluation data, independent validation, assessment of clinical utility and scrutiny of population differences and confounding. A study that finds different RNA profiles between known responders and nonresponders does not automatically provide a reliable way to predict the outcome of a new patient.
The timing of sampling is particularly important. A pretreatment biomarker question differs from a post-treatment response-mechanism question. Researchers also need to consider whether a bulk RNA profile reflects true changes within cells or a shift in the proportions of cell types, especially in blood and heterogeneous tissues.
Bulk RNA-seq versus single-cell RNA-seq: which should researchers choose?
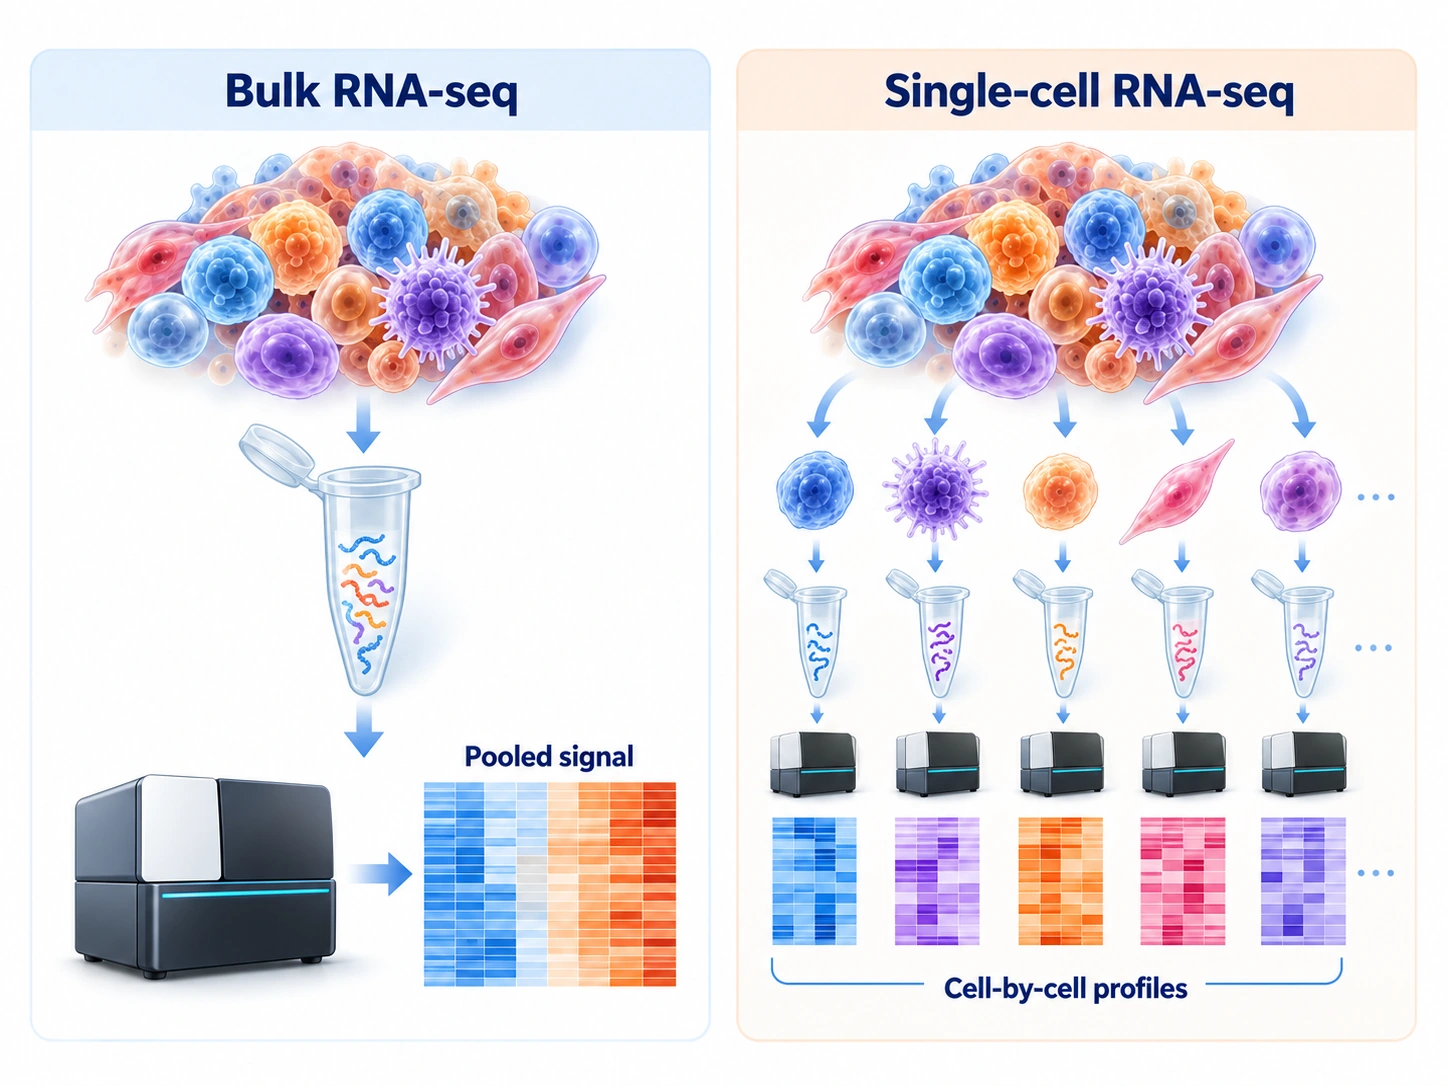
Bulk RNA-seq is often appropriate when the main question concerns overall expression patterns across samples, particularly when studies require many biological replicates or have practical constraints. As illustrated in Figure 07, single-cell RNA-seq can reveal cellular subpopulations and cell-specific states that are averaged together in bulk data, but it introduces its own experimental costs, technical limitations and analytical challenges. Study design, specimen availability, desired resolution and budget should determine the choice—not a blanket claim that one technology is more advanced.
Common RNA-seq mistakes that can mislead beginners
• Treating technical repetitions of one specimen as independent patients.
• Comparing groups whose sample collection or sequencing batches are completely confounded.
• Calling every gene with a nominal p-value below 0.05 a robust finding.
• Using TPM or FPKM values as if they were raw counts in count-based tests.
• Interpreting a PCA cluster as proof of biological mechanism or clinical prediction.
• Ignoring missing metadata, incompatible reference versions or sample-label errors.
• Equating changes in RNA abundance with changes in protein function or treatment benefit.
• Reporting only selected genes without complete analysis settings and result tables.
Frequently asked questions about bulk RNA-seq analysis
Is bulk RNA-seq the same as gene expression analysis?
Bulk RNA-seq is one way of measuring RNA abundance and conducting gene expression analysis. Other technologies also measure gene expression. The correct technique depends on the biological question, the required resolution and available samples.
How many biological replicates are needed for RNA-seq?
There is no universal number suitable for every experiment. A useful sample-size decision depends on the expected variability, the magnitude of a difference worth detecting, the study design, and power considerations. In human studies, clinical heterogeneity often makes careful planning especially important. [9]
Do I need coding skills to analyze RNA-seq data?
Not necessarily. Some platforms offer guided interfaces for established analysis steps. However, a no-code interface does not remove the need to understand the study design, metadata, limitations of statistical methods, quality indicators and interpretation. Users should confirm what methods and file formats a particular platform actually supports.
What is the difference between a FASTQ file and a count matrix?
FASTQ stores sequencing reads and their quality scores. A count matrix is a later analytical table that organizes gene-level values across samples. It depends on reference sequences, quantification choices and processing assumptions, so it cannot tell the entire story of how the data were produced.
What is the difference between differential expression and pathway analysis?
Differential expression evaluates evidence about individual genes or features under a specified comparison. Pathway analysis examines patterns across sets of genes associated with biological functions. A pathway result is an interpretation layer, not a direct measurement of pathway activity.
Can a volcano plot tell me which genes cause a disease?
No. A volcano plot summarizes estimated expression differences and statistical evidence. A visually prominent gene may be a useful candidate for further study, but causal statements require a stronger body of evidence.
Can RNA-seq results be used directly to choose a patient’s medication?
Not on the basis of an exploratory RNA-seq analysis alone. Clinical decision-making requires validated tests, appropriate evidence, professional interpretation and applicable regulatory and clinical safeguards.
How long does RNA-seq analysis take?
There is no reliable single duration. Timing depends on the number of samples, file sizes, sequencing quality, reference preparation, computing resources, the chosen workflow, and how extensively results must be reviewed and validated.
A practical reporting checklist for credible, reproducible RNA-seq studies
Good reporting makes it possible for another researcher to understand—and where appropriate reproduce—an analysis. A methods description should identify the biological replicates; inclusion and exclusion rules; sample collection and library methods; single- or paired-end layout; reference genome and gene annotation versions; QC procedures; quantification approach; statistical formula and contrast direction; filtering and multiple-testing decisions; and versions of software used. Share complete result tables and relevant diagnostic outputs where data-governance rules permit. [3–5]
When working with patient-derived samples, de-identification and authorized data sharing are particularly important. Scientific transparency does not mean disclosing identifiable clinical information. The safest reporting practices combine analytical reproducibility with institutional ethics requirements and applicable privacy obligations.
Where BulkMind AI fits into the workflow
RNA-seq analysis involves many linked decisions, from matching files to patients through checking quality and reviewing results. A guided platform can help researchers keep those stages organized. BulkMind AI, a Vaxonyx platform, is one option to explore at https://bulkmindai.vaxonyx.com/. Before starting a project, check its current documentation for supported organisms, input formats, statistical methods and available outputs.
The purpose of this article is education rather than product validation. Software can help perform computations and display results; it cannot rescue a confounded experiment, replace biological replication or establish a therapeutic mechanism on its own.
The most important lesson
Bulk RNA-seq can reveal patterns that are difficult to see in a clinic or under a microscope. In our patient study, the data might point to molecular differences between people who respond to a drug and those who do not. Whether those differences are useful depends on the study behind them: how patients were selected, when samples were taken, how the data were processed and whether the findings hold up in another group.
A strong RNA-seq study does not need to explain everything. It should leave readers knowing what was measured, what the evidence supports and what remains uncertain. Often its most valuable contribution is showing researchers what to test next.
References and further reading
[1] Conesa A, et al. A survey of best practices for RNA-seq data analysis. Genome Biology. 2016;17:13. https://doi.org/10.1186/s13059-016-0881-8
[2] Love MI, Huber W, Anders S. Moderated estimation of fold change and dispersion for RNA-seq data with DESeq2. Genome Biology. 2014;15:550. https://doi.org/10.1186/s13059-014-0550-8
[3] ENCODE Consortium. ENCODE4 bulk RNA-seq data standards. https://www.encodeproject.org/data-standards/encode4-bulk-rna/
[4] nf-core. RNA-seq pipeline documentation. https://nf-co.re/rnaseq
[5] DESeq2 Bioconductor. Analyzing RNA-seq data with DESeq2: reference vignette. https://bioconductor.org/packages/release/bioc/vignettes/DESeq2/inst/doc/DESeq2.html
[6] Dobin A, et al. STAR: ultrafast universal RNA-seq aligner. Bioinformatics. 2013. https://doi.org/10.1093/bioinformatics/bts635
[7] Patro R, et al. Salmon provides fast and bias-aware quantification of transcript expression. Nature Methods. 2017. https://doi.org/10.1038/nmeth.4197
[8] Ewels P, et al. MultiQC: summarize analysis results for multiple tools and samples in a single report. Bioinformatics. 2016. https://doi.org/10.1093/bioinformatics/btw354
[9] Schurch NJ, et al. How many biological replicates are needed in an RNA-seq experiment? RNA. 2016. https://doi.org/10.1261/rna.053959.115
[10] Anders S, Huber W. Differential expression analysis for sequence count data. Genome Biology. 2010. https://doi.org/10.1186/gb-2010-11-10-r106
[11] Soneson C, Love MI, Robinson MD. Differential analyses for RNA-seq: transcript-level estimates improve gene-level inferences. F1000Research. 2015. https://doi.org/10.12688/f1000research.7563.2
[12] Law CW, et al. voom: precision weights unlock linear model analysis tools for RNA-seq read counts. Genome Biology. 2014. https://doi.org/10.1186/gb-2014-15-2-r29
[13] Robinson MD, McCarthy DJ, Smyth GK. edgeR: a Bioconductor package for differential expression analysis. Bioinformatics. 2010. https://doi.org/10.1093/bioinformatics/btp616
[14] Liao Y, Smyth GK, Shi W. featureCounts: an efficient general purpose program for assigning sequence reads to genomic features. Bioinformatics. 2014. https://doi.org/10.1093/bioinformatics/btt656
[15] Benjamini Y, Hochberg Y. Controlling the false discovery rate: a practical and powerful approach to multiple testing. JRSS B. 1995. https://doi.org/10.1111/j.2517-6161.1995.tb02031.x
Publication and editorial note
Published by Vaxonyx LLC for scientific education. The patient study is fictional, not evidence for any medication or a recommendation for treatment. This article has not undergone independent journal peer review. The named authors should verify the final scientific content, citations, credentials and product references before publication. Editorial drafting tools contributed to preparation; responsibility for the published version rests with the credited authors following their review.